Maximum Likelihood Estimation is one of the most important concepts in machine learning, which is used to maximize the performance of the model by getting the best-fit values for the parameters of the algorithms to use with the likelihood function.
In this article, we will discuss the probabilities, conditional probabilities, likelihood, maximization of likelihood, and maximum likelihood estimation with the complete workflow of the MLE in machine learning.
This article will help one to understand the core idea and intuition behind the maximum likelihood estimation and will help to study the other terminologies related to the same.
Before directly jumping to the likelihood and maximization of the likelihood, let us first discuss the probabilities and conditional probabilities. So let’s dive into it.
What are Probabilities?
Probabilities can be defined as the chance of some event happening or a chance of something occurring. The probability can be calculated with the help of the ratio of event count and total count.
For example, when tossing a coin, there is a 0.5 probability of a head and 0.5 probability of tails appearing, which means there is an equal chance of heads or tails to come when tossing a fair coin.
The probabilities can vary between the values 0 to 1, where the value near 0 means there is very less chance of something happening, whereas the probability value near 12 means there is a high chance of something happening.
The probabilities are very important terminologies that are the base of the maximum likelihood, although normal probabilities are not used. Instead, the conditional probabilities are used in the maximum likelihood estimation. So let us discuss the conditional probability then.
What is Conditional Probability?

Conditional probability is a type of probability that is calculated or measured with respect to some conditions. It is a more advanced and accurate probability than the normal or classic probability, but also the calculations involved are complex.
The conditional probability can be referred to as a probability that is measured with respect to some events or a chance of some event 1 to happen with respect to another event 2, where the other event 2 can affect the probability of event 1.
For example, the probability of someone going for a walk when the weather is sunny or the probability of someone going for a walk when the weather is rainy.
The formula of the conditional probability can be written as:
P(A|B) = P(B|A) P(B) / P(A)
Where,
P(A) = Probability of event A to happen
P(B) = Probability of event B to happen
P(A|B) = Probability of event A to happen when B is happening
P(B|A) = Probability of event B to happen when A is happening
Conditional probabilities are very important terms that are used in maximum likelihood estimation, which helps the likelihood function to make the calculations and get the best values of the parameters of the models.
Now let us discuss the likelihood as we have an idea about the probabilities and conditional probabilities.
The Likelihood Function
The likelihood function can be considered as the product of conditional probabilities, which, as the name suggests, is a function that represents the likelihood of the given pair of data to occur.
Here the likelihood function is a measure of the data points or the data pairs (input-output pairs) to occur, which represents the likeliness of the data to occur.
The likelihood function is calculated with the help of conditional probability, where the conditional probability of the given data points to occur in the same sequence is calculated with the initially assumed parameters.
Here the parameters are the ones that are to be tuned in such a way that model performs better, and theta is to be used to maximize the likelihood function. For example, the parameters can be slope (m) and coefficient (c) in the case of linear regression.
In short, the likelihood function shows how likely we are going to observe the input-output pairs of the data, which initially defined parameters (m and c).

Now let us try to understand the same with an example. Let us suppose we have a fair coin, and we are tossing the coin five times, where we are getting a sequence like HTTHH. Where H means heads and T means tails.
Observation 1 = Heads (H)
Observation 2 = Tails (T)
Observation 3 = Tails (T)
Observation 4 = Heads (H)
Observation 5 = Heads (H)
In this case, the likelihood function will be the probability of the conditional probability of getting the same sequence with the initial parameters. The initial parameters can be the slope (m) and coefficient (c) in this case if we are using logistic regression, as the problem here is a classification problem.
So the likelihood will be the function of the conditional probability of the same sequence happening with given parameters.
Likelihood = Function(Probability of Same sequence to Happen | Parameters)
Let us say that the probability of getting a head is p and which is 0.5.
Likeolihood = p * (1-p) * (1-p) * p * p = 0.5 * (1-0.5) * (1-0.5) * 0.5 * 0.5 = 0.015625
Here we are getting the likelihood as 0.015625, which means there is a chance of 0.015625 for the same sequence to occur with a given set of parameters.
Note that there is a slight difference between the probability, conditional probability, and the likelihood, where the probability is a simple change of some event to occur, conditional probability is a chance of some event to occur with respect to some other events, and the likelihood is the chance of something or the likeliness of something to happen with a given set of parameters.
Let us dive into the maximization of the likelihood function in how it is done, as we have an idea about the likelihood function now.
Maximizing the Likelihood
Now as we have a likelihood function of the data, the next goal is to maximize the likelihood or to maximize the likeliness of the given sequence of data to occur by tuning the parameters of the model.
Now this likelihood is a function of the conditional probability of a given set of sequences of the data and the parameters of the model, where the conditional probabilities can not be changed but the parameters can be changed, and hence tuning the parameters can help maximize the likelihood function.
So, in short, maximization of the likelihood function with tuning or with the help of parameters is known as the maximum likelihood approach, where the maximum likelihood is achieved.
Note that all these processes are done internally by the algorithm, which uses the maximum likelihood estimation to set and tune the parameters to be optimized.
Now that we have an idea about all the related terminologies, let us discuss the maxim likelihood estimation.
Maximum Likelihood Estimation
Maximum likelihood estimation is a process that consists of calculating the conditional probabilities, measuring the likelihood function, and maximizing the function by tuning the parameters of the model. The complete process is known as the maximum likelihood estimation, where the maximum likelihood is estimated by calculating it first and then maximizing it using parameters.
There are many algorithms in machine learning that use the maximum likelihood estimation to get the best-fit parameters for the model. Some of them are:
- Linear Regression
- Logistic Regression
- Decision Trees
- Neural networks
- Naive Bayes
- Random forest
- Gradient Boosting
- Support Vector Machines (SVM)
- Hidden Markov Models (HMM)
- Gaussian Mixture Models
Now that we have an idea about each term related to the maximum likelihood estimation let us discuss the complete workflow of the same step-by-step.
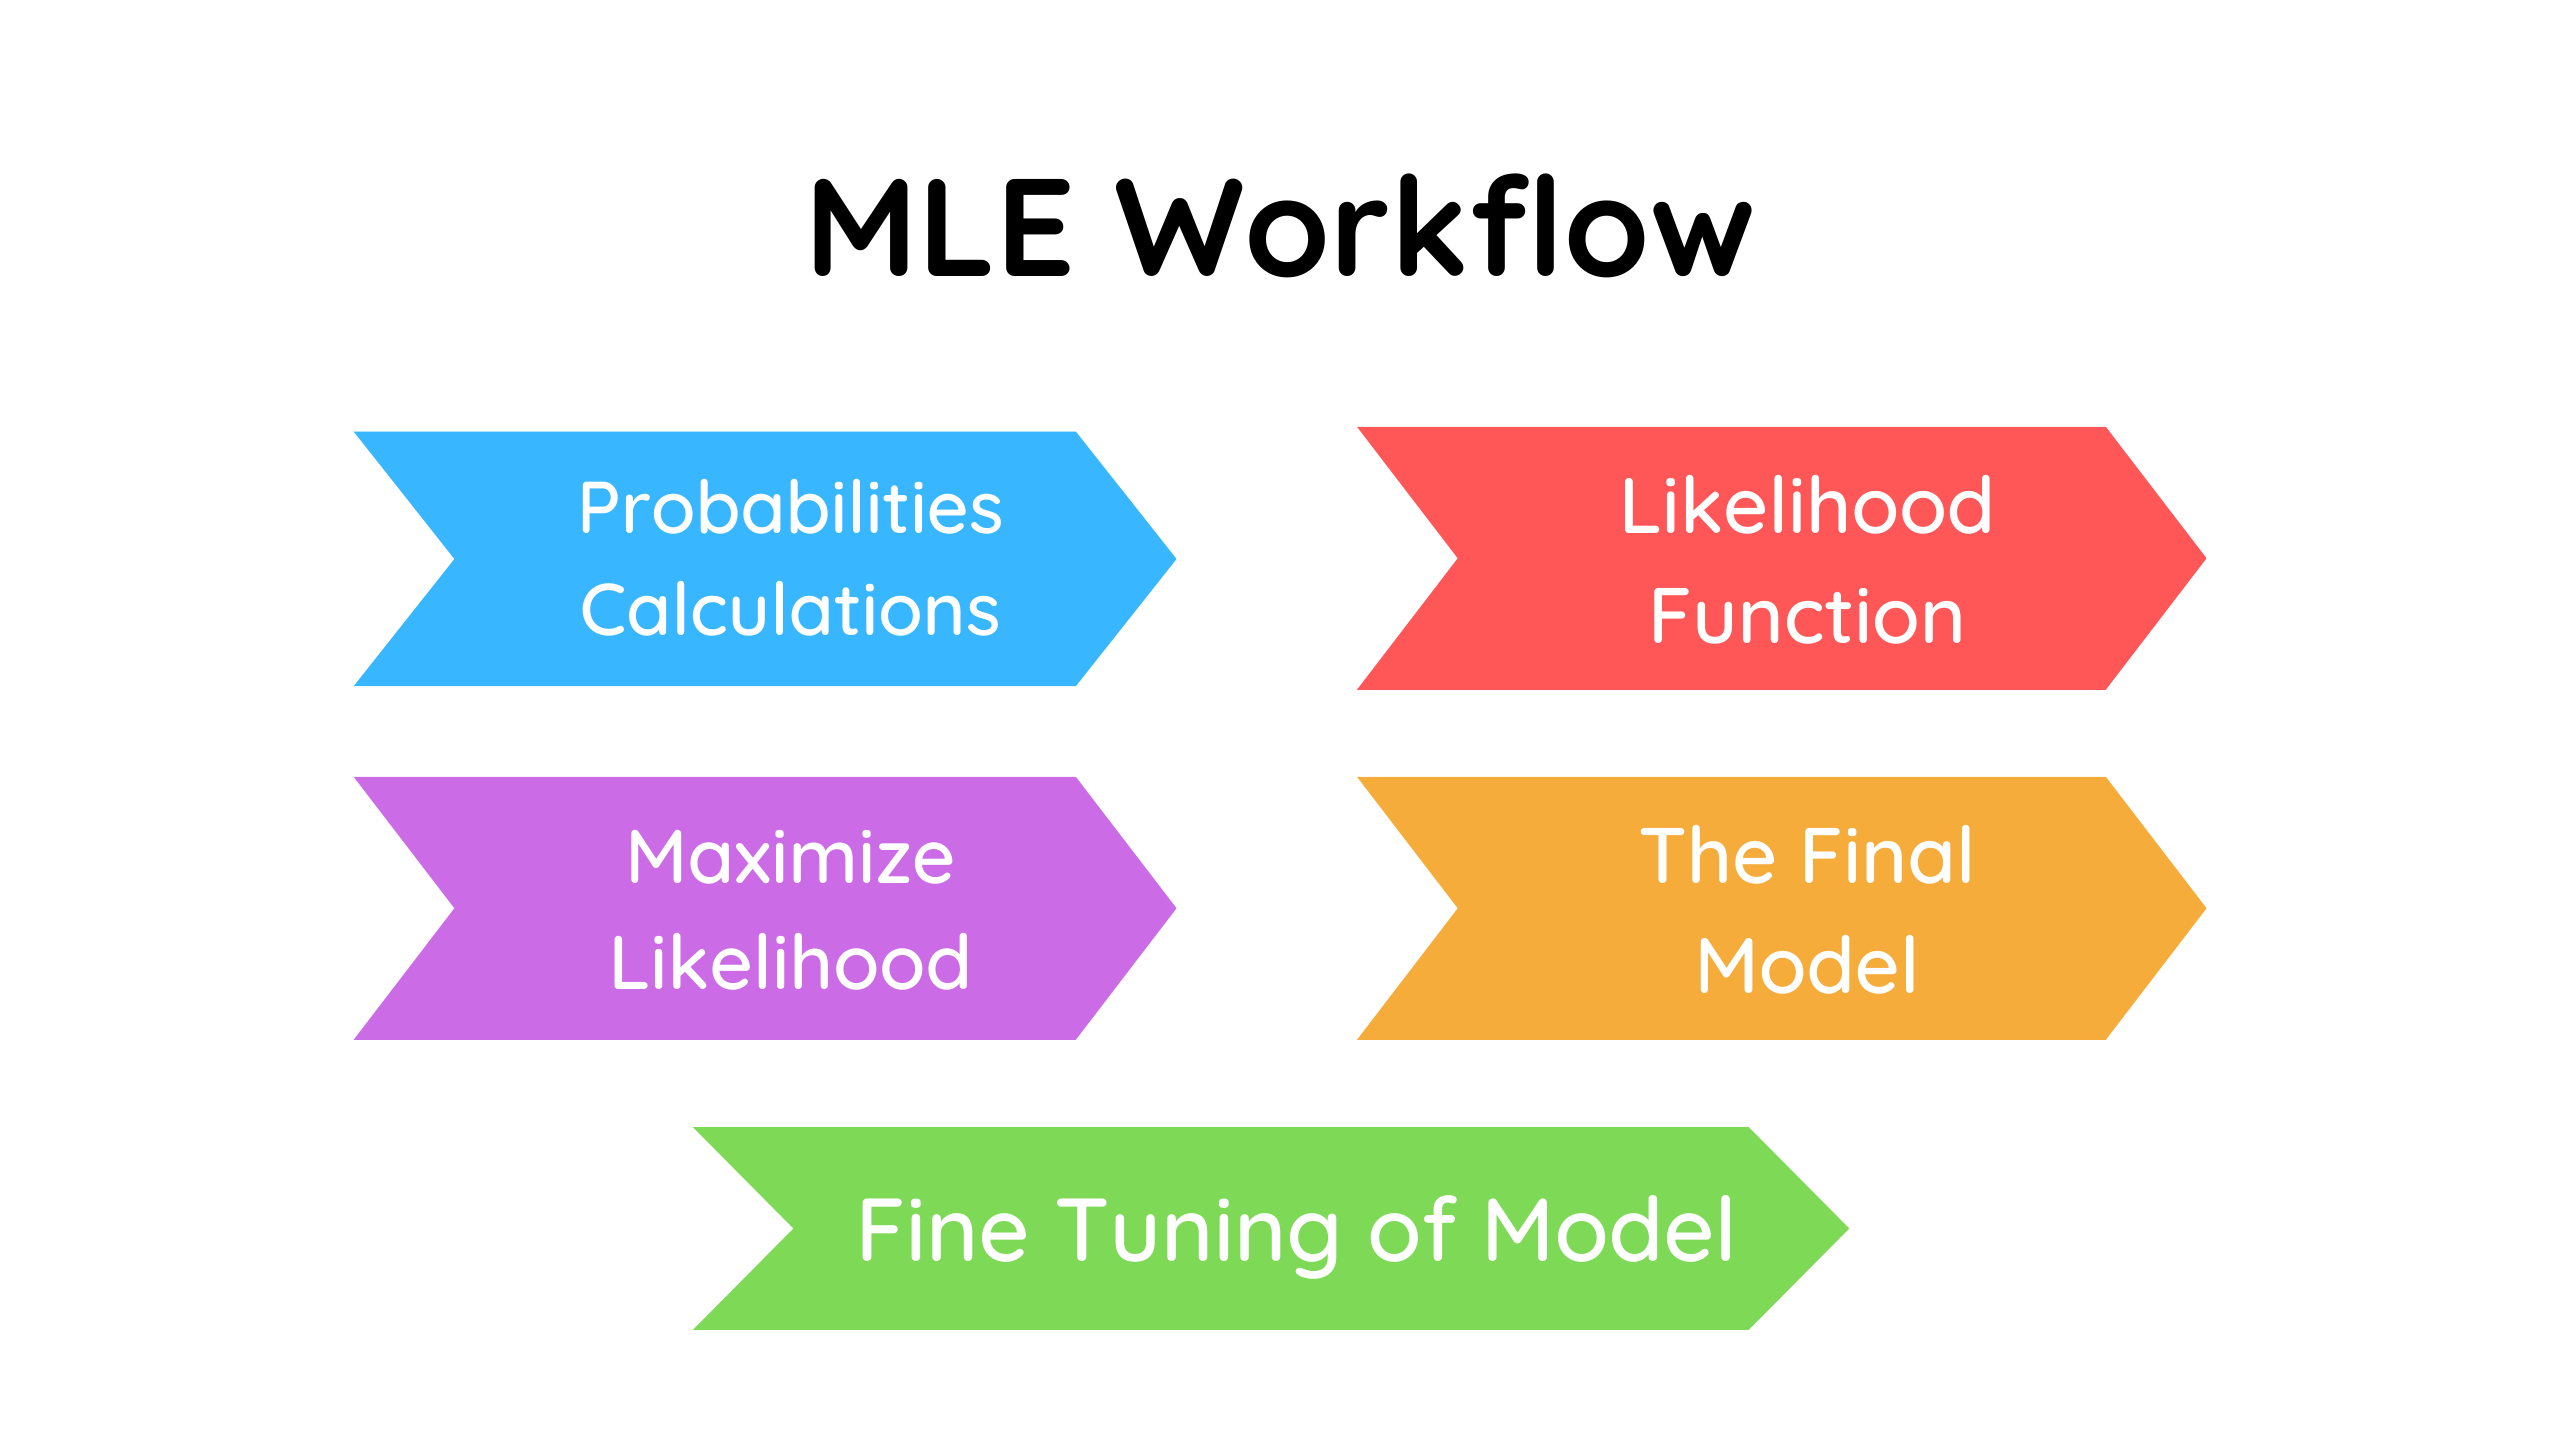
Workflow of Maximum Likelihood Estimation (MLE)
There are majorly five steps involved in the maximum likelihood estimations process. Let us try to understand each one of them deeply.

Step 1: Calculations of Conditional Probabilities
In this step, the conditional probability of the data to occur is calculated. In this very first step, conditional probability will be the most effective parameter that will affect the final result of the maximum likelihood estimation.
Step 2: Defining the Likelihood Function
In this step, the likelihood function for the dataset is defined, where the function will be a product of conditional probabilities of the data. Here the conditional probabilities of data pairs or the input-output pairs will be calculated with the initial parameters assumed.
Step 3: Maximizing the Likelihood
Once the likelihood has been calculated, the next step is to maximize it. As we can not change the conditional probability, the parameter can be changed, and hence the optimization algorithms or techniques are used which perform some processes iteratively and find the best values of the parameters.
Step 4: The Final Model
Now as the best values of the parameters have been determined, they are used in the final model, and the model is finally trained on the training data, which is now more accurate than ever.
Step 5: Fine Tuning
This is the final and optional step in the model building, where once the model has been trained, the values of the hyperparameters can be changed, and the performance of the model can be optimized.
The distribution of the data also plays a key role in the maximum likelihood estimations, which are discussed below.
Effect of Data Distribution on MSE
The data distribution plays a very important role in the process of maximum likelihood estimation, where the likelihood function is affected by the data distribution and hence the maximum likelihood estimation.
Here to calculate the likelihood function, the probabilities and conditional probabilities are calculated given the values of a parameter. Here while calculating the conditional probabilities and probabilities, the data distribution plays a major role.
But before discussing the effect of data distribution on the likelihood function, we need to understand the two very important terms related to the data distribution, which are,
- Probability Distribution
- Probability Density Function
1. Probability Distribution
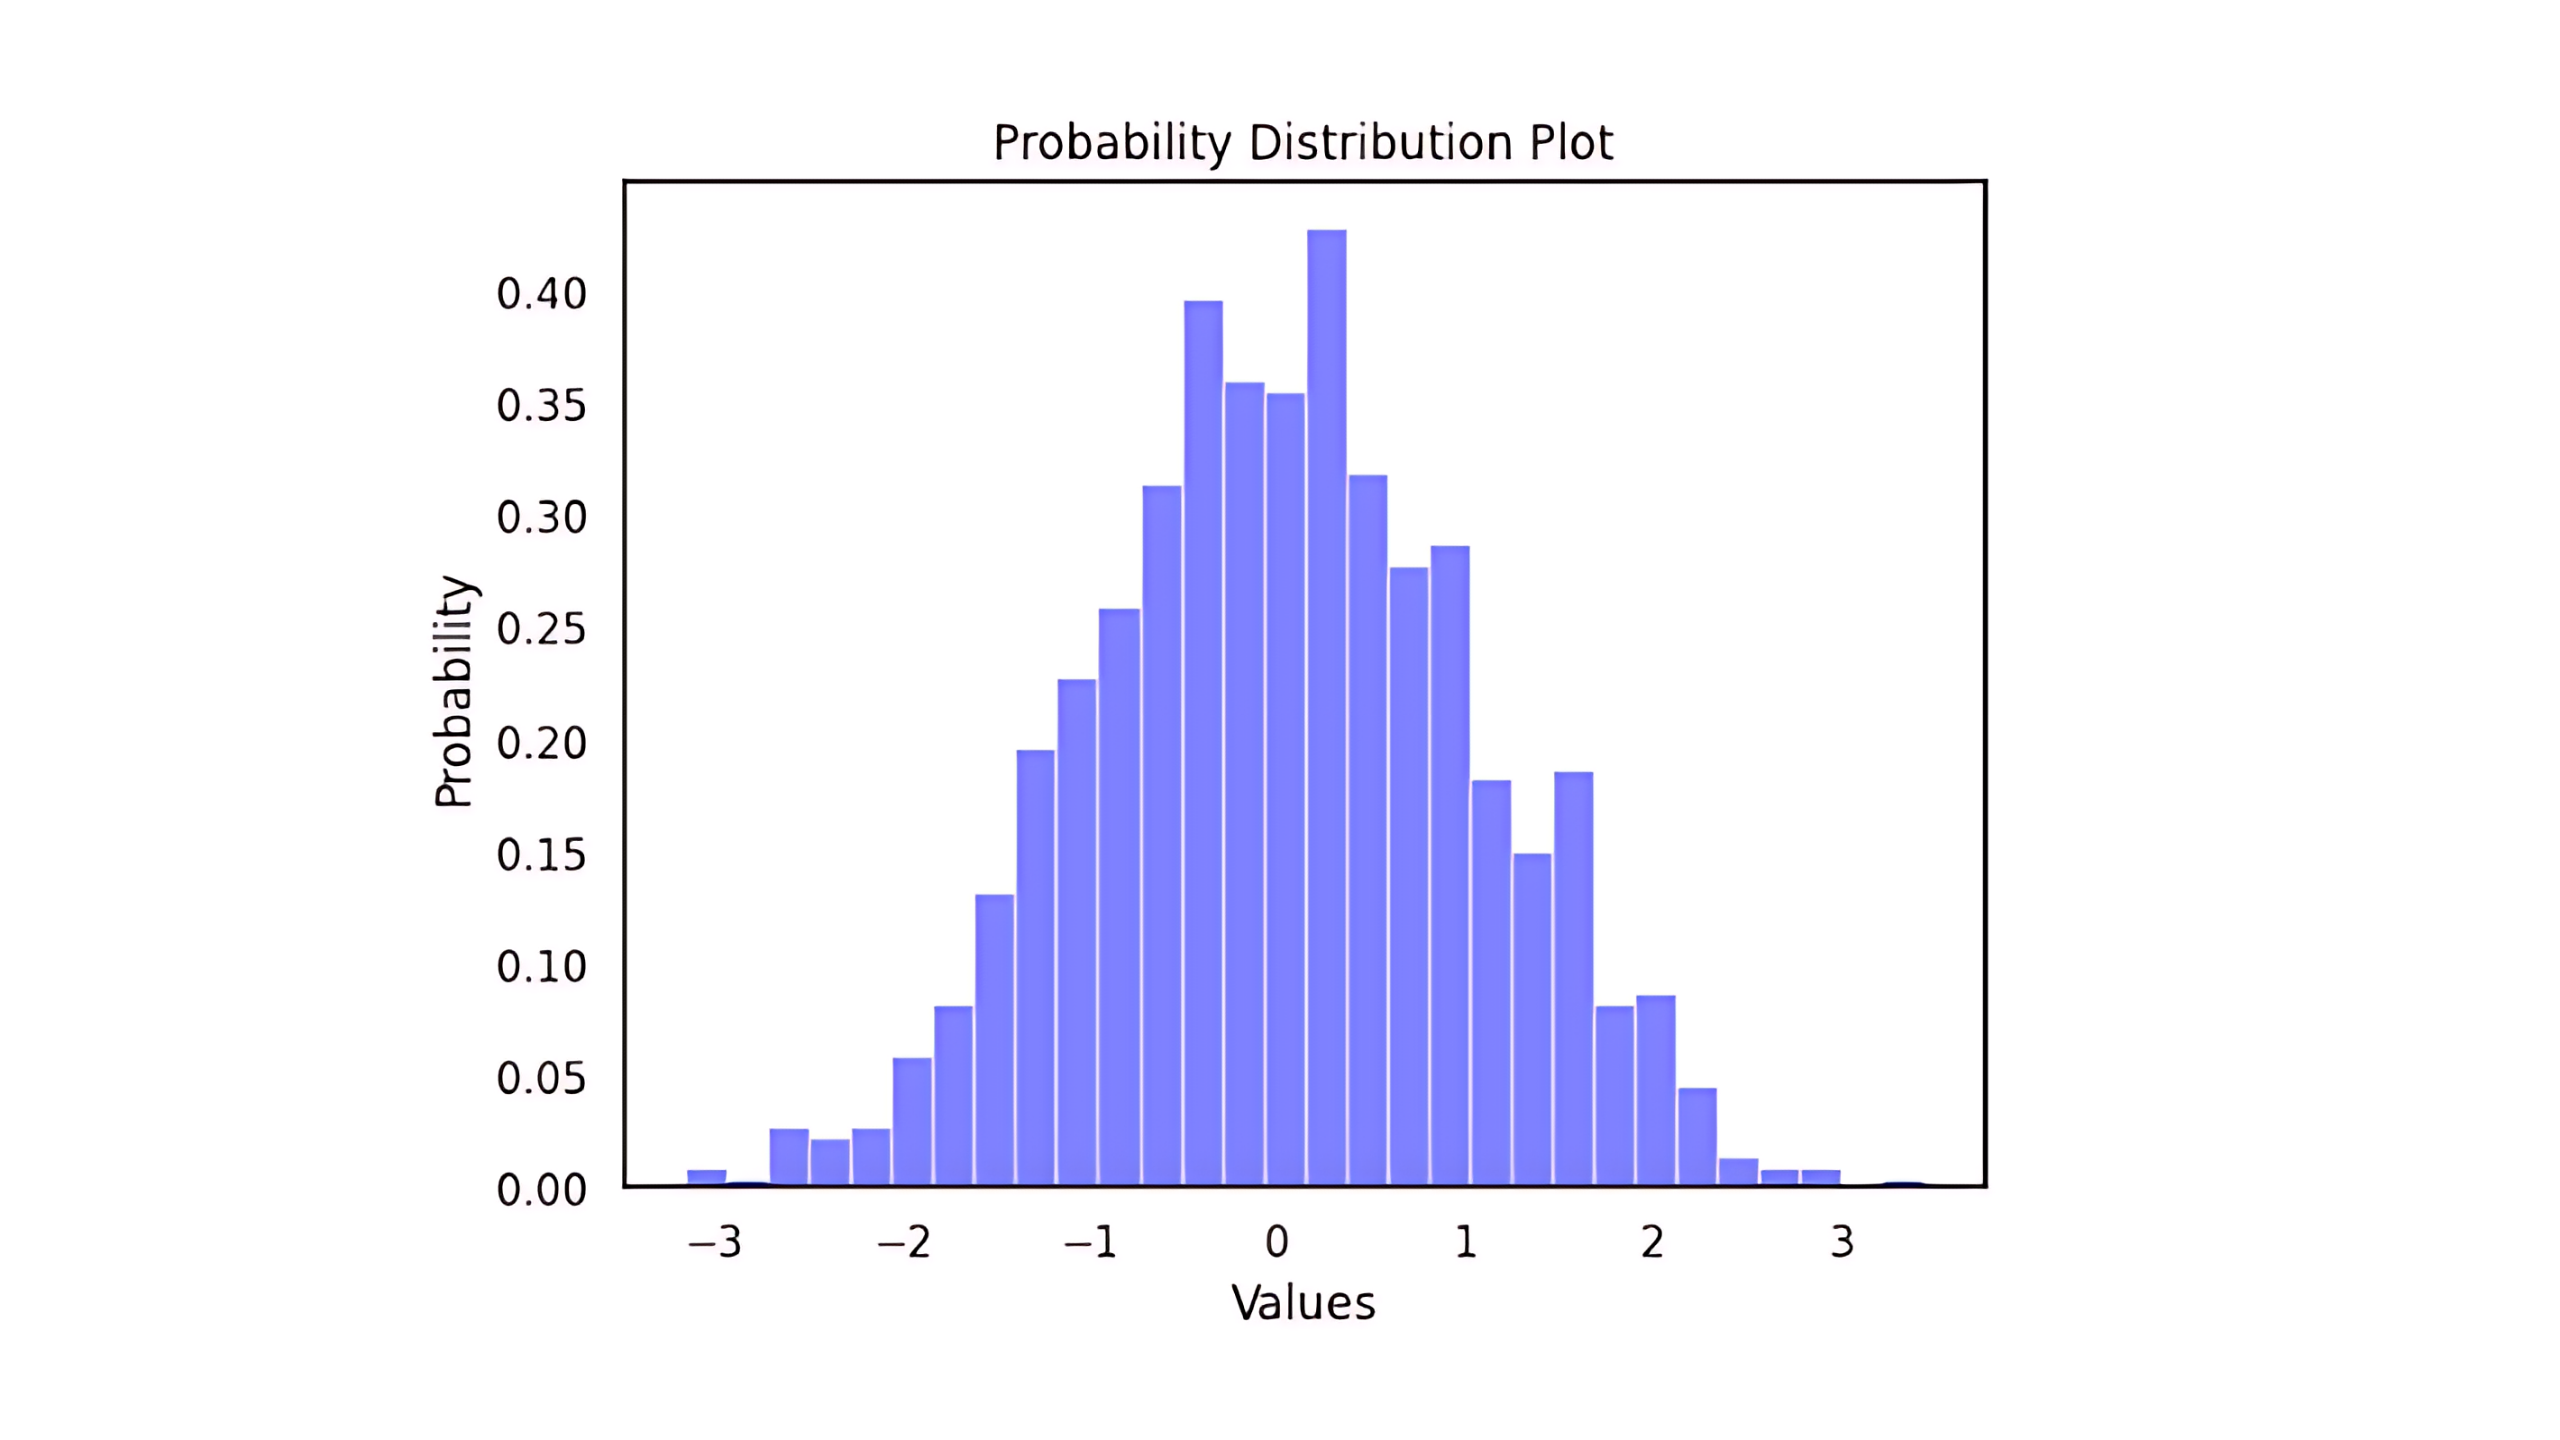
Probability distribution is a type of plot or concept that represents the probability of an event happening. It represents tor signifies the probability of a variable to be a certain value or an event happening under certain conditions.
Let us suppose we have a fair coin toss, here, the possible outcomes are heads and tails. The probability of each outcome here is 0.5. So the probability distribution is a function that returns the probability of each outcome of a variable, and it can be represented as a histogram or a table.

In the above image, we can see the plot of the probability distribution, which contains or represents the probabilities of certain values to occur in the dataset. These kinds of plots are known as probability distribution plots.
2. Probability Density Function (PDF)
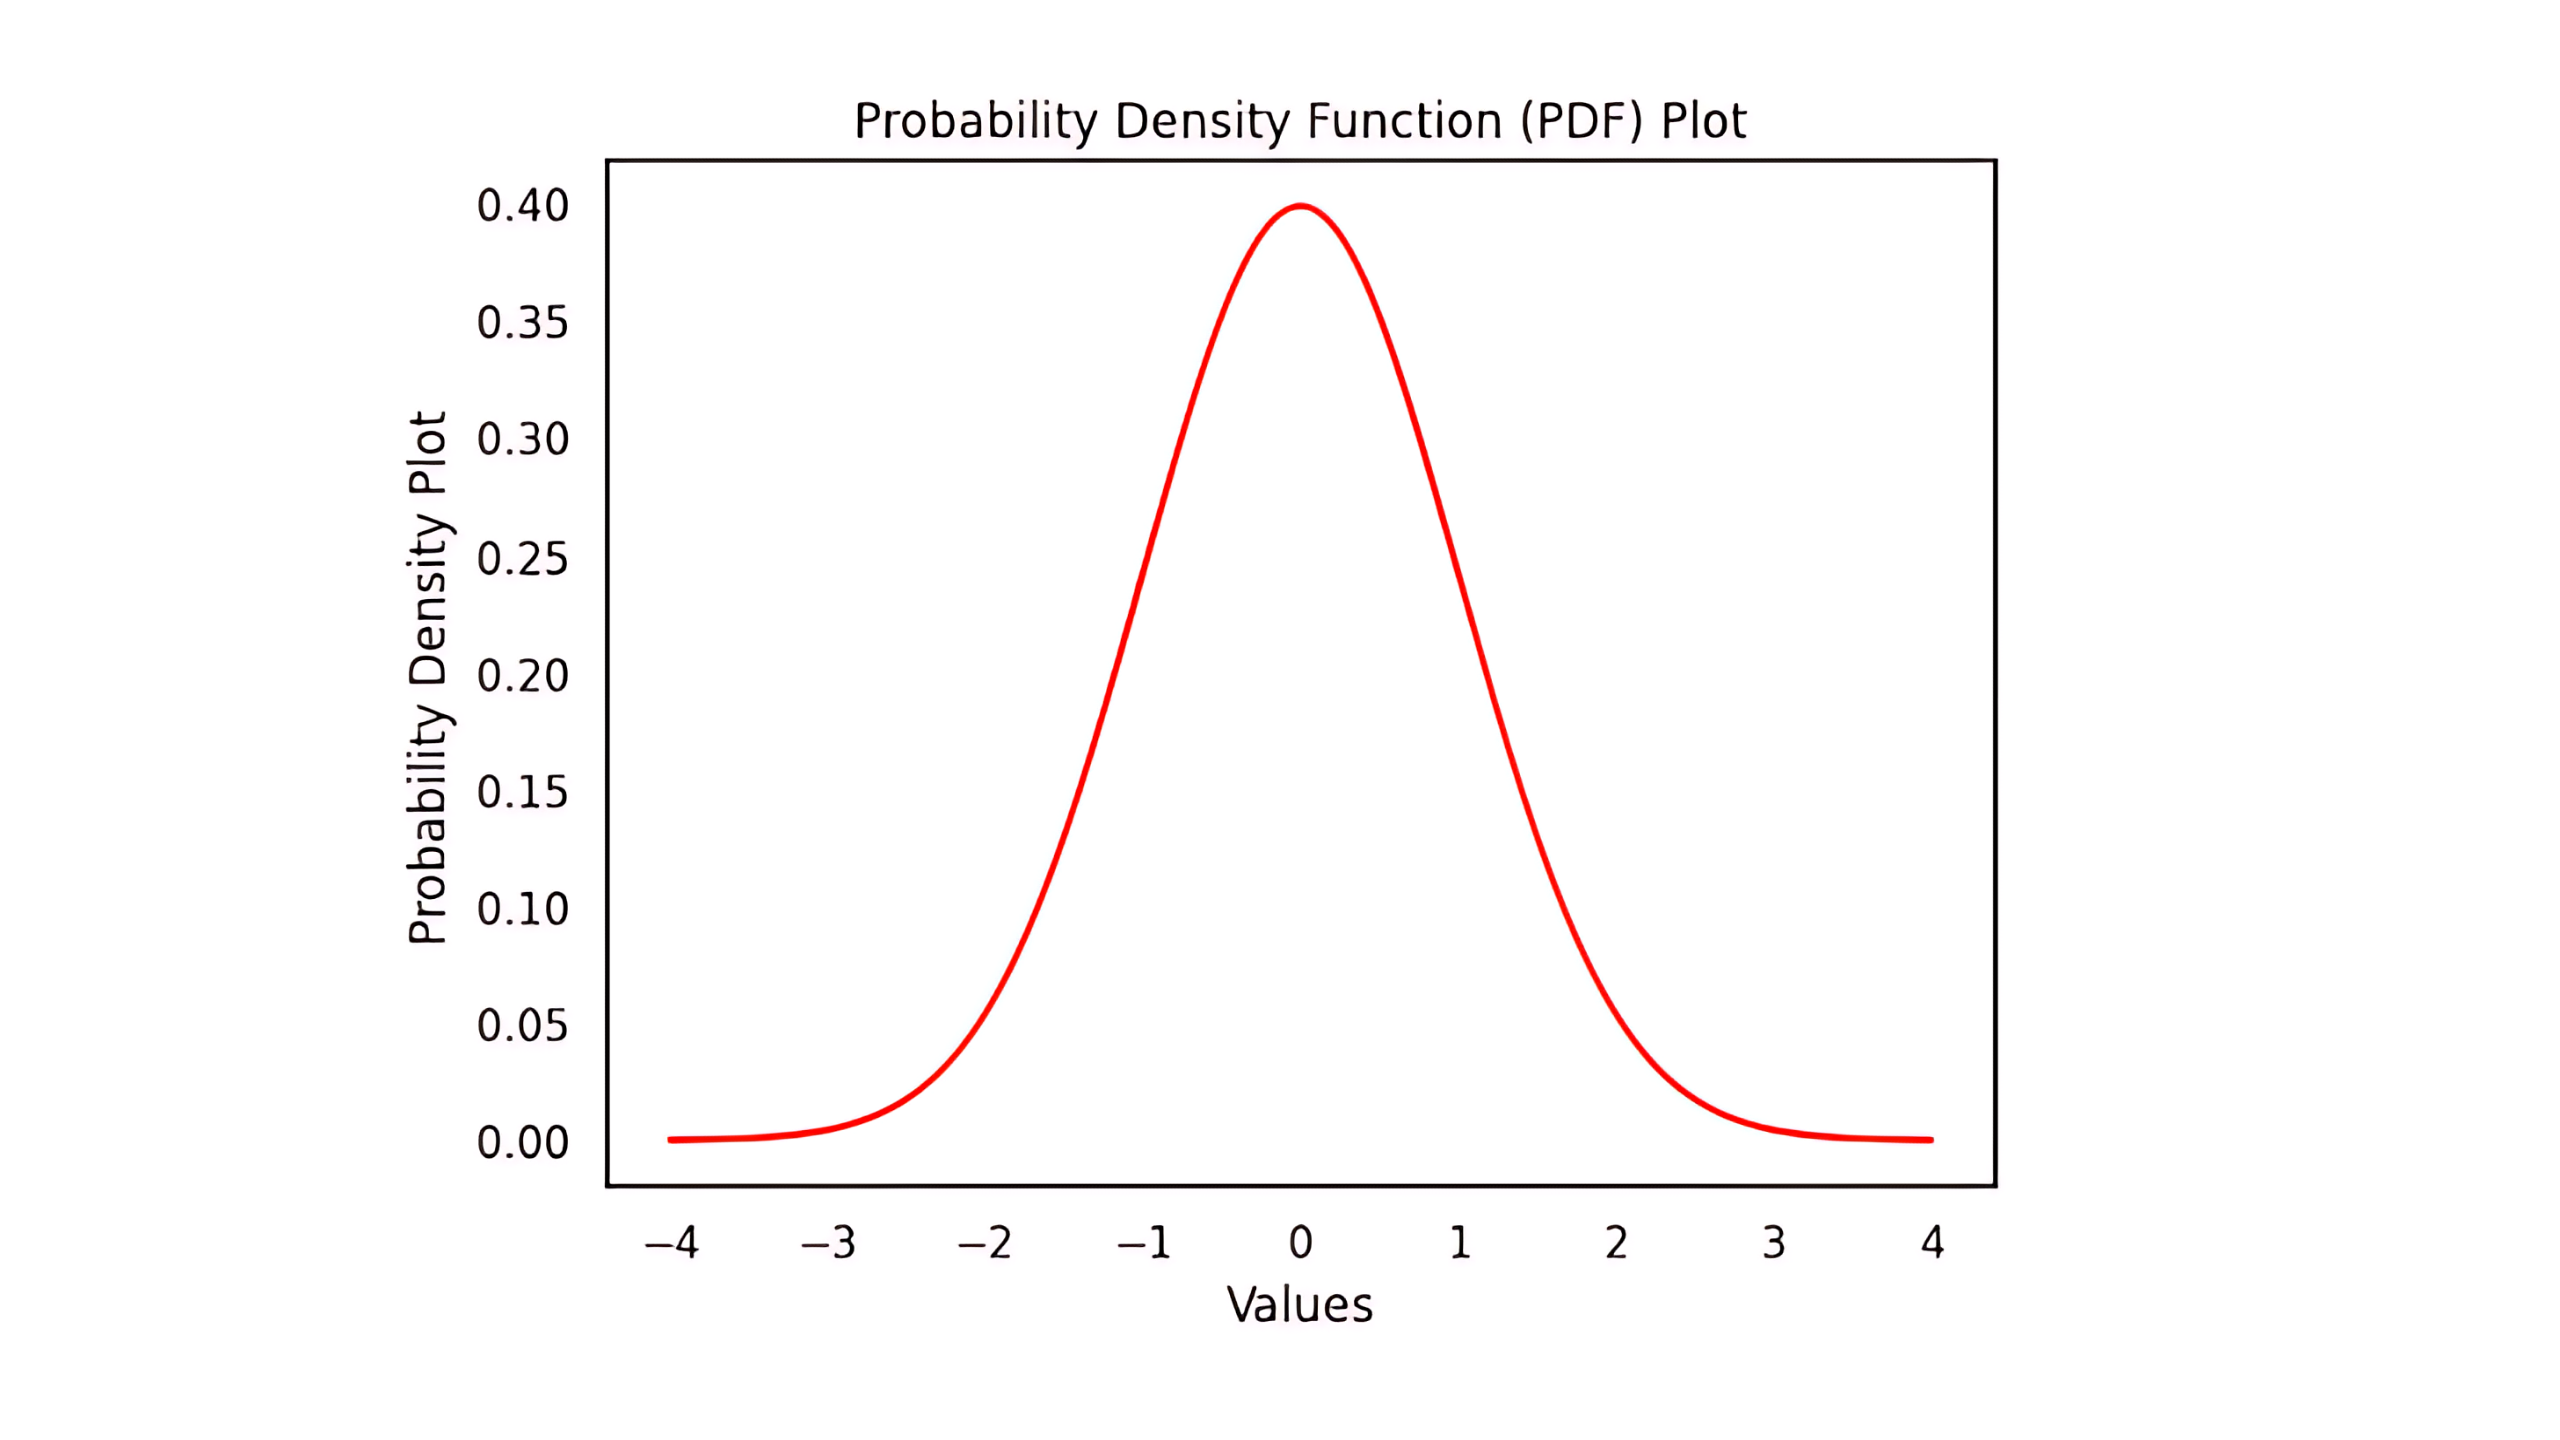
The probability density function helps to get the probability of an event or the probability of a variable falling within a certain range of values. for example, the probability of any student falling within the marks range of 70 to 90.
Let us suppose we have the height of some persons. Now if these values are plotted in a graph, we get a scatter plot, but if the density of these values is plotted I’m a graph, we get a density plot or a probability density plot (PDF). Now this plot can be helpful in determining that what is the chance of a person having a height between the range of 10 to 20.

In the above graph, we can see the PDF plot or a probability density function plot which represents the probability of a certain value falling within a specific range.
In simpler words, the probability distribution plot gives the value probability frequency of a value in a particular variable which is the measure of the number of times that value occurred in the variable divided by the total number of values that occurred in the variables. At the same time, the probability density plot (PDF) gives a probability density of a value in the variable, which is the probability of a variable falling within a specific range.
Although both of the plots look the same almost all the time and many times, they are considered the same terminologies; the slight difference is that the probability distribution is more focused toward the probabilistic frequency of values in the variables, whereas the pdf plot is more focused toward the probability of a random value to fall within a certain range.
These PDF values can then be used to get the conditional probabilities and which help determine the likelihood function, and this is how their data distribution ultimately helps to get the likelihood function and can affect the likelihood function very effectively.
So when the data distribution changes, the probability distribution changes, and the PDF plot changes, which ultimately changes the likelihood function and the maximum likelihood estimation process.
Although, there are some cases where the maximum likelihood fails badly.
Where Does the MLE Fail?
There are some cases where the maximum likelihood estimation fails and returns poor results. The possible cases are listed below.

1. Insufficient Data
If we have a very less amount of data that is not sufficient for the training of the model, the maximum likelihood estimation fails as it cannot measure the likelihood function accurately, which results in no maximization in the actual likelihood of the data and poor parameter estimations.
2. Outliers
The maximum likelihood function is very sensitive to outliers, which fails when there is an outlier present in the data. This is due to the false calculation of probabilities and likelihood function due to the outlier values present in the dataset.
3. Complex Models
The maximum likelihood also fails in the case of a very complex model, which has a very high amount of parameters, where the maximum likelihood estimation can not get the best-fit values for all the parameters.
4. Non-Identifyibilty
If there are multiple parameters to get the best first value using the MLE and if the likelihood of the parameters is the same, then in such cases, the MLE fails very badly and does not give accurate results.
Key Takeaways
1. The probability is a chance of some event to occur, whereas conditional probability is a chance of an event to occur with respect to some other events.
2. The likelihood is a product of a conditional probability calculated with specified initial parameter values.
3. The likelihood function signifies the conditional probability of a data pair occurring with considering the initially assumed parameters.
4. The initially assumed parameter values are then tuned according to the performance of the model, which is known as the maximization of the likelihood.
5. Maximum likelihood estimation is the process of estimating the best-fit parameter values for the model based on conditional probabilities and likelihood functions.
6. The maximum likelihood estimation involves six steps, which are conditional probability and likelihood calculations, maximization of the likelihood, predicting with the model, and fine-tuning the model.
7. The data distribution also affects the maximum likelihood estimation process, where it affects the probability distributions and probability density plot (PDF), and so the likelihood function.
8. The maximum likelihood fails in case of limited data, outliers, complex models, and non-identifiability of the model.
Conclusion
In this article, we discussed the probabilities, conditional probabilities, likelihood function, maximization of the likelihood, finding the best-fit values of the patterns, and the complete workflow of the maximum likelihood estimation process. We also discussed the data distribution effects on the likelihood function and where the maximum likelihood estimation fails.
This article concludes that maximum likelihood estimation consists of defining the likelihood function with the help of conditional probabilities and maximizing it by tuning the parameters of the model, which is also affected by the distribution of the data.
This article will help one to understand the complete maximum likelihood estimation from scratch and will help clear all the relevant doubts.